

Introduction
In the quick-changing world of money and investments, traders constantly seek effective strategies to navigate the ups and downs of price movements. One such strategy gaining popularity is the combination of Exponential Moving Average (EMA) and Moving Average Convergence Divergence (MACD). In this blog post, we will delve into the details of this powerful strategy, outlining steps to implement it successfully.
Setting the Stage
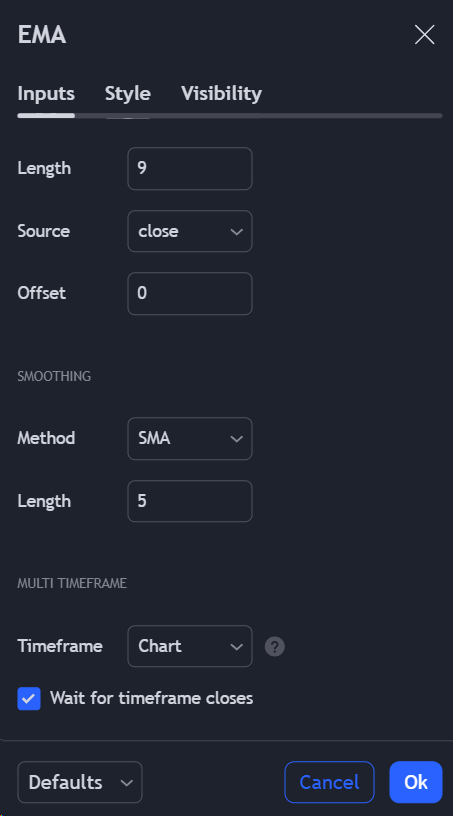
Imagine the trading chart as your battleground, where the EMAs and MACD act as your loyal generals. Our initial step involves deploying a 14-period EMA to identify trends and potential entry points. Think of this EMA as a sturdy bridge guiding you across the price movements.
Detailed Video

Trade Execution
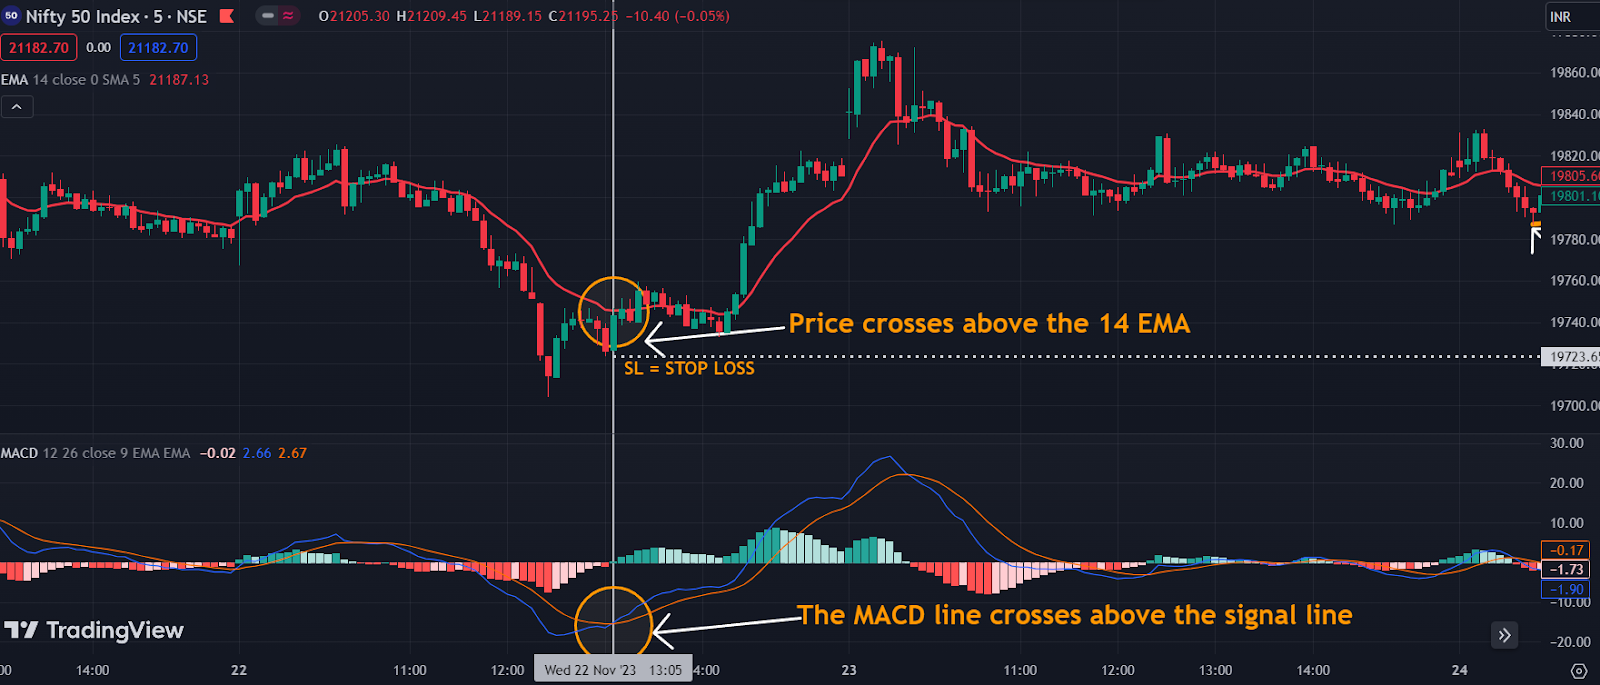
The key trigger for initiating a trade using this strategy occurs when two conditions are met simultaneously:
1.When price crosses above the 14 EMA and the MACD line to cross above the signal line, then take buy entry and place the stop loss at the low of the candle preceding the entry candle.
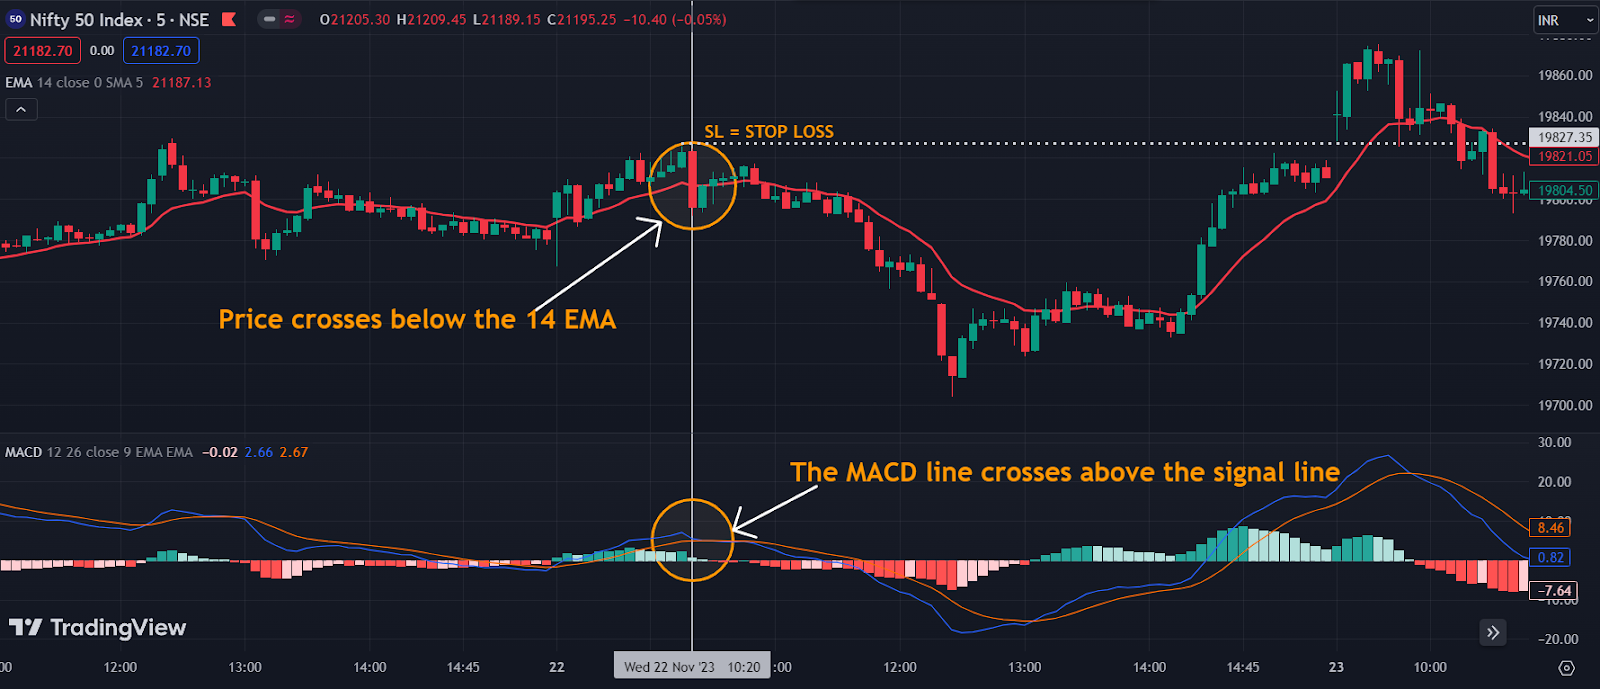
2.when price to cross below the 14 EMA and the MACD line to cross below the signal line, then take sell entry and place the stop loss at the high of the candle preceding the entry candle.
Victory Awaits
With both conditions met, it's time to charge into the market. Take a buy entry and position your stop-loss at the low of the candle preceding the entry candle. These well judged measures act as a shield, safeguarding you from unexpected market reversals.

Turning the Tide
But what if the market whispers bearish tales. Fear not, for the strategy adapts. When the price falls below the 14 EMA and the MACD line dips below the signal line, a bearish scenario unfolds. Just like a swift pivot on the battlefield, take a sell entry and place your stop-loss at the high of the candle preceding the entry candle. Remember, even in retreat, calculated operations minimise potential losses.
Risk Management
To safeguard against potential losses, it's crucial to implement effective risk management measures. In this strategy, placing a Stop Loss (SL) at the low of the previous entry candle serves as a prudent approach. This ensures that if the trade moves against expectations, losses are limited to a predefined level.
Targeting Profit
Setting a realistic profit target is an integral part of any trading strategy. With this MACD and EMA strategy, traders aim for a Risk-Reward Ratio (RRR) of 1:2 or 1:3. This implies that for every unit of risk (as defined by the Stop Loss), the trader seeks a reward of two or three units. This approach helps in maximising gains relative to the risk undertaken.

Conclusion
Incorporating the MACD and EMA strategy into your trading arsenal can offer a systematic approach to identifying favourable entry points and managing risks effectively. By aligning technical indicators like the EMA and MACD, traders enhance their ability to make informed decisions in the ever-changing landscape of financial markets.
As with any trading strategy, it's essential to conduct thorough backtesting, adapt to market conditions, and stay disciplined in executing trades. While there are no guarantees in trading, a well-defined strategy can significantly improve the odds of success. Embrace the power of the MACD and EMA strategy, and may your trades be filled with prosperity and success.
Disclaimer:
Please note that this blog is not any recommendation for buying or selling any stock. We always encourage the reader to do their research before investing in any stock.