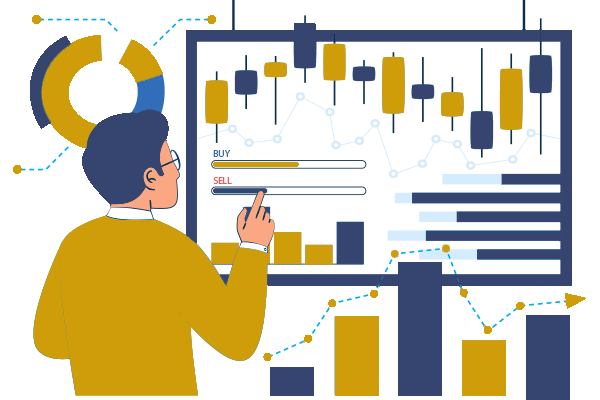
In the Indian Stock Market, intraday (or day) trading is the practice of buying and selling stock within the same day. This is done in order to profit from minor fluctuations in stock prices at the end of each trading day. In order to make informed and rapid decisions in trading, the use of technical intraday trading indicators is essential.
The Nifty and Bank Nifty indices are among the several Indian stock exchange indices that can change positions frequently. In an Indian stock market that is always changing, the use of intraday stock market trading indicators is essential. These indicators are essential for developing a consistent intraday trading technique.
No indicator will ever lead to guaranteed profits. The most effective intraday trading indicators are the ones that are the simplest to use and are effective for short time periods (for example, 5-15 minute segments).
In this guide, you will learn about the 5 most popular and most effective technical intraday trading indicators, and you will learn the practical use of each indicator, the best time to use each indicator, their best settings for intraday use, and the best method to combine them for an effective intraday trading technique.

1. A Look at Moving Averages, More Specifically, the Exponential Moving Average (EMA)
Selling When the Price is Moving Average is one of the most well-known and most widely used technical indicators of intraday trading due to its effectiveness in eliminating the noise of data points over a given time and establishing the underlying trends. We will prefer Exponential Moving Averages (EMAs) to Simple Moving Averages (SMAs) because out of the two, EMA is more responsive for most intraday trading made by the Last Line.
Two of the most widely used periods (in minutes) for an EMA are 9 and 21. A bullish signal is made when the 9 EMA crosses over the 21 EMA, and a bearish signal is made when the 21 crosses over the 9.
How to do intraday trading in the Indian stock market? Buy when the price is above both EMAs and the shorter one crosses over, and use both of the EMAs as support and resistance. This works well in Indian stocks. The pros are simple in concept and are a good trend filter. The cons are that they are lagging indicators.

2. The Relative Strength Index (RSI)
RSI is one of the best intraday trading indicators and works over a given time, and based on 70 and 30 values, they give sell and buy signals respectively.
Use standard 14-period RSI on 5-minute or 15-minute charts for intraday. In strong trends, for quicker signals, use a 2-period RSI.
These visuals show RSI signalling overbought/undersold levels and divergences, important for day trading in India, as momentum shifts are common.
How to use: Buy when RSI crosses above 30 from undersold and sell when it drops below 70 from oversold. Look for divergences (if price makes a new high, RSI doesn't) for reversals. In RSI MACD intraday strategies, RSI validates momentum. Pros: Great for range-bound markets. Cons: In trends, it can remain overbought/undersold for a while.

3. Moving Average Convergence Divergence (MACD)
MACD is a trend-following momentum indicator. It shows the relationship between 2 EMAs (usually 12-period and 26-period) and a 9-period signal line. There are the MACD line, signal line, and histogram.
MACD is particularly good in RSI MACD intraday setups because MACD shows trend changes and RSI determines entry.
This image shows MACD crossovers and shifts in the histogram for buy/sell signals.
Intraday Uses: The first level of bullishness is when the MACD crosses above the signal line and becomes bearish when the MACD crosses below the signal line. The zero-line cross is a confirmation of the trend. For Indian markets, these are ideally used in 15-minute charts for Nifty.
Combine this with the RSI where you buy when the RSI is above 50 and the MACD has a bullish cross.
Pros: Captures momentum shifts. Whipsaws in sideways markets are a con.

4. Bollinger Bands
Bollinger Bands consist of three bands, the 20 SMA (Middle Band) and the two outer bands (which are 2 standard deviations away from the upper and lower), and are great for finding intraday trading strategies due to the constant expansion and contraction of the bands due to volatility.
Whenever a band squeeze occurs, this means there is low volatility which could lead to a breakout. These images show examples of a squeeze and the explosive movements that tend to follow.
Usage: After a squeeze, look for the close outside the bands and trade breakouts. In a trend, ride the upper (bullish) or lower (bearish) band. Use with RSI for confirmation, and don’t buy if RSI is overbought.
Pros: shows where it's more or less volatile. In this case, using Bollinger Bands is good for predicting the trend. The downside is that breakouts don't always work.

5. Stochastic Oscillator
The Stochastic Oscillator measures where the closing price is in relation to its price range over 14 periods (default), and is made of two lines, %K and % D, which range from 0 to 100. The Stochastic Oscillator is good for picking the momentum of the market for short-term, intraday trades. Each of these crosses are examples of a momentum shift that the stochastic provides. The signal line is also a cross to signal the overbought and oversold, which are at 80 and 20, respectively.
These examples show stochastic crossovers along with the signal line, overbought and oversold.
How to use: Buy when %K is greater than %D in the oversold zone, then sell when they cross below in the overbought zone. Look for divergences to identify reversals. In day trading India, use this in 5-minute time frames for short plays.
Pros: Early signals.
Cons: Trends give a lot of false signals.
Building an Effective Intraday Trading Strategy with These Indicators
Use the best intraday indicators in combination for better odds in trades.
A common RSI MACD intraday strategy
Use MACD to determine the overall trend, then use RSI to time your entries. For instance, enter a long position when MACD indicates a bullish crossover, and RSI shows that the price is not oversold.
Use Bollinger Bands for trend filtering, Moving Averages for volatility, and Stochastic for fine-tuning. Always use a stop-loss (1-2% risk), and have a target that is a 1:2 ratio to your risk. Low-volume trading should be avoided.
In the Indian market, focus on the most liquid stocks or single-issue indices. Trade in the high-volume times (9:15 AM - 3:30 PM IST) and test your strategies beforehand.
Conclusion
Perfecting the use of these top 5 technical indicators for intraday trading, Moving Averages, MACD, RSI, Bollinger Bands, and Stochastic Oscillator, will give you a better edge when day trading in India. These indicators should be combined in different ways, as no single one will help you create substantial intraday trading strategies. Use a demo account to practice, manage your risk, and be disciplined.
Consistent use of these stock market indicators should help you with some of the challenges of intraday trading. Happy trading!